Adding forced liquidation to my backtest inverted the answer it had been giving me for months
I run eleven automated crypto trading bots. One of them, a SOL strategy on the 5-minute chart, had been running at 15x leverage for months because a backtest told me 15x made more money than 10x.
That backtest had no forced liquidation in it. The engine tracked position size, entry price, fees, slippage and stop losses, and it never once asked whether the exchange would have closed the position out from under me first. Isolated margin does exactly that, and it does not care what your stop loss says.
I added liquidation to the engine and re-ran the same four years. The comparison does not shift. It inverts.
What the same data says once margin calls exist
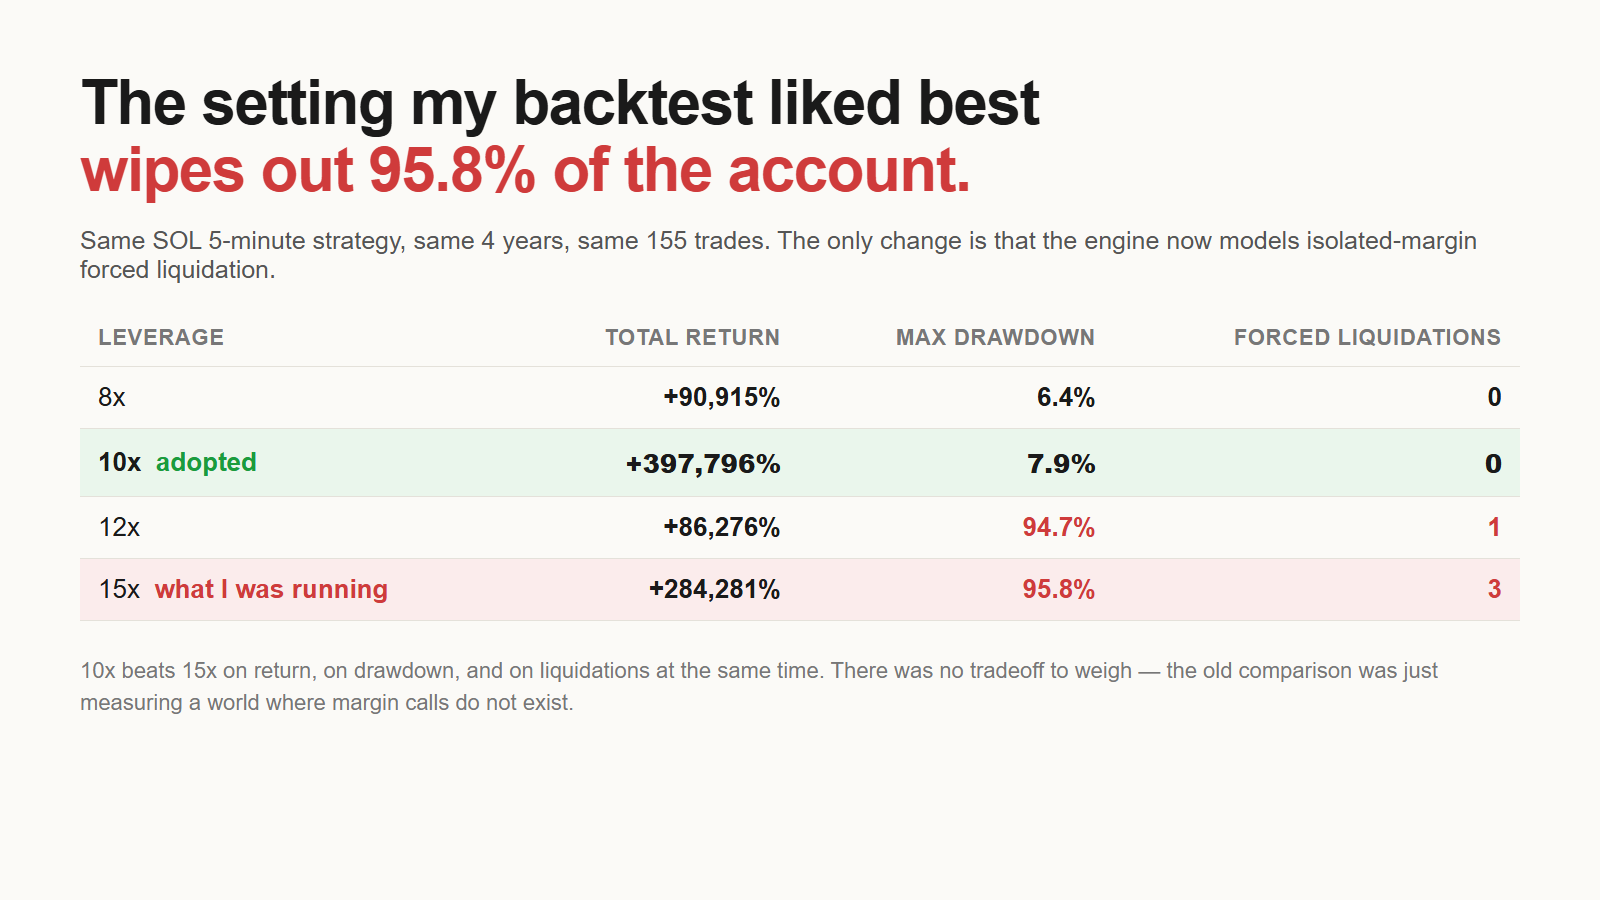
Same strategy, same four years, same 155 trades. The only change is the liquidation model.
15x returns less than 10x, draws down twelve times harder, and gets liquidated three times. There is no tradeoff here to think carefully about. 10x wins on every axis at once, which is the shape you get when the losing option was never really being measured.
The 12x row is the one that taught me something. It gets liquidated once in four years, and one liquidation is enough to put maximum drawdown at 94.7 percent. Liquidation is not a gradual penalty that scales with how often it happens. The first one already takes the account.
Why 15x was never going to survive
Isolated margin liquidates at roughly (1/leverage − maintenance margin) away from your average entry price. That is a fixed distance you can compute before running anything, and comparing it against the worst move in your history takes about a minute.
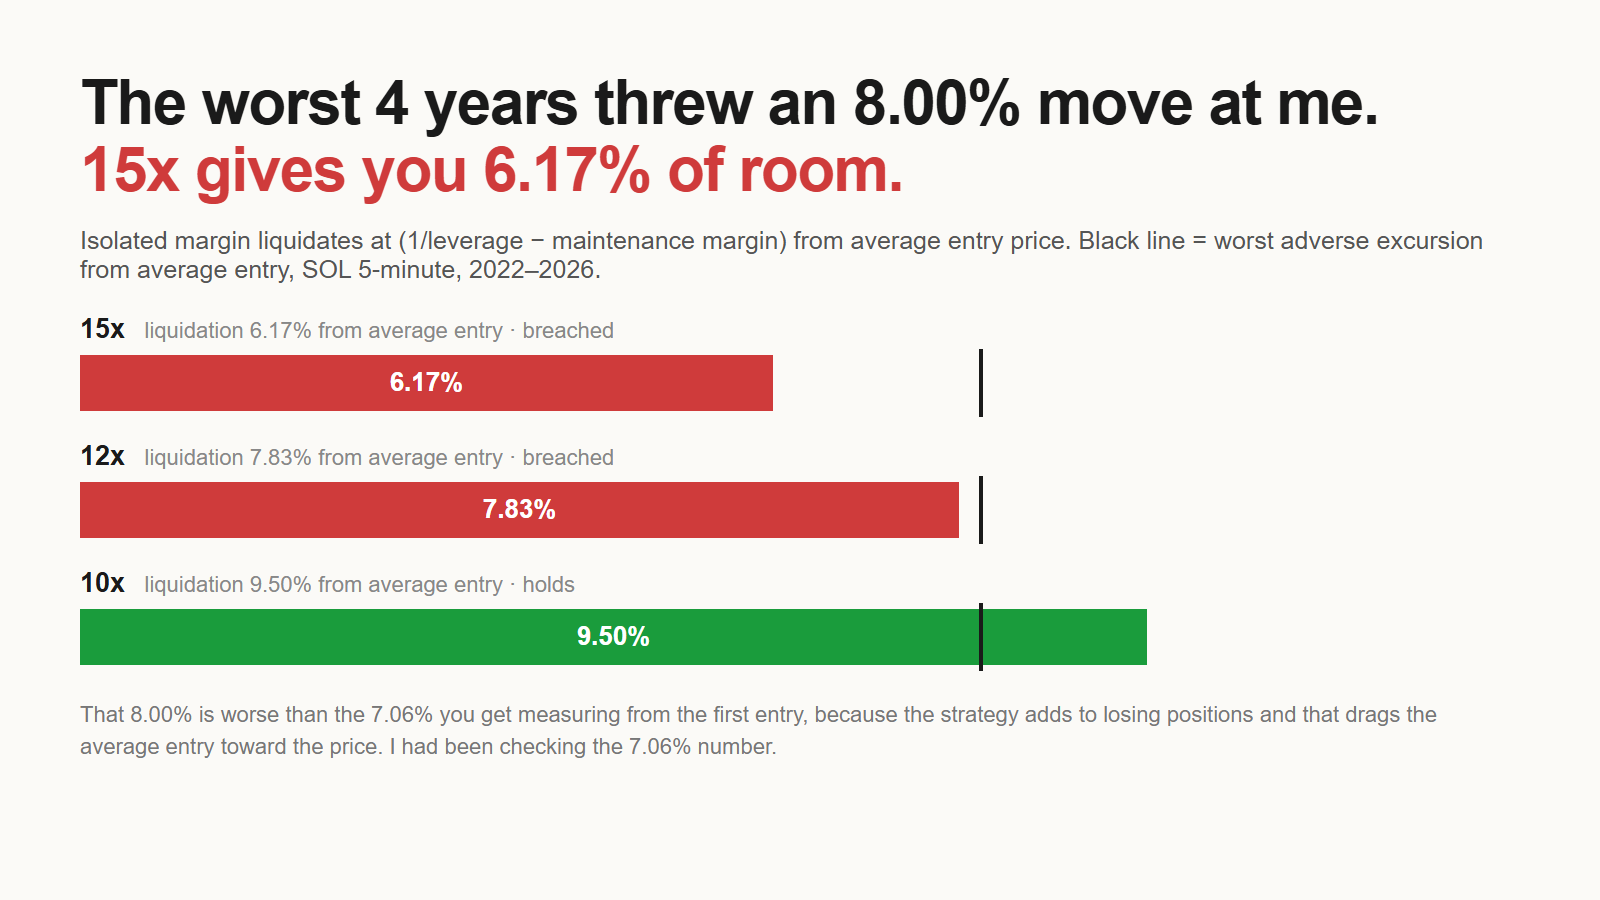
I had run that check. I got the wrong answer because I measured from the wrong price.
This strategy adds to losing positions. When it does, the average entry price moves toward the current price, and the liquidation line moves with it. Measured from where the first entry went in, the worst four-year drawdown against an open position is 7.06 percent, which 15x survives with room to spare. Measured from the average entry after the adds, the same event is 8.00 percent, and 15x does not survive it.
The number I needed and the number I checked differed by 0.94 percentage points, and that gap is the whole account.
The bug I found while fixing the bug
Changing the leverage constant meant touching liquidation_price(), and reading it properly for the first time turned up something unrelated and worse.
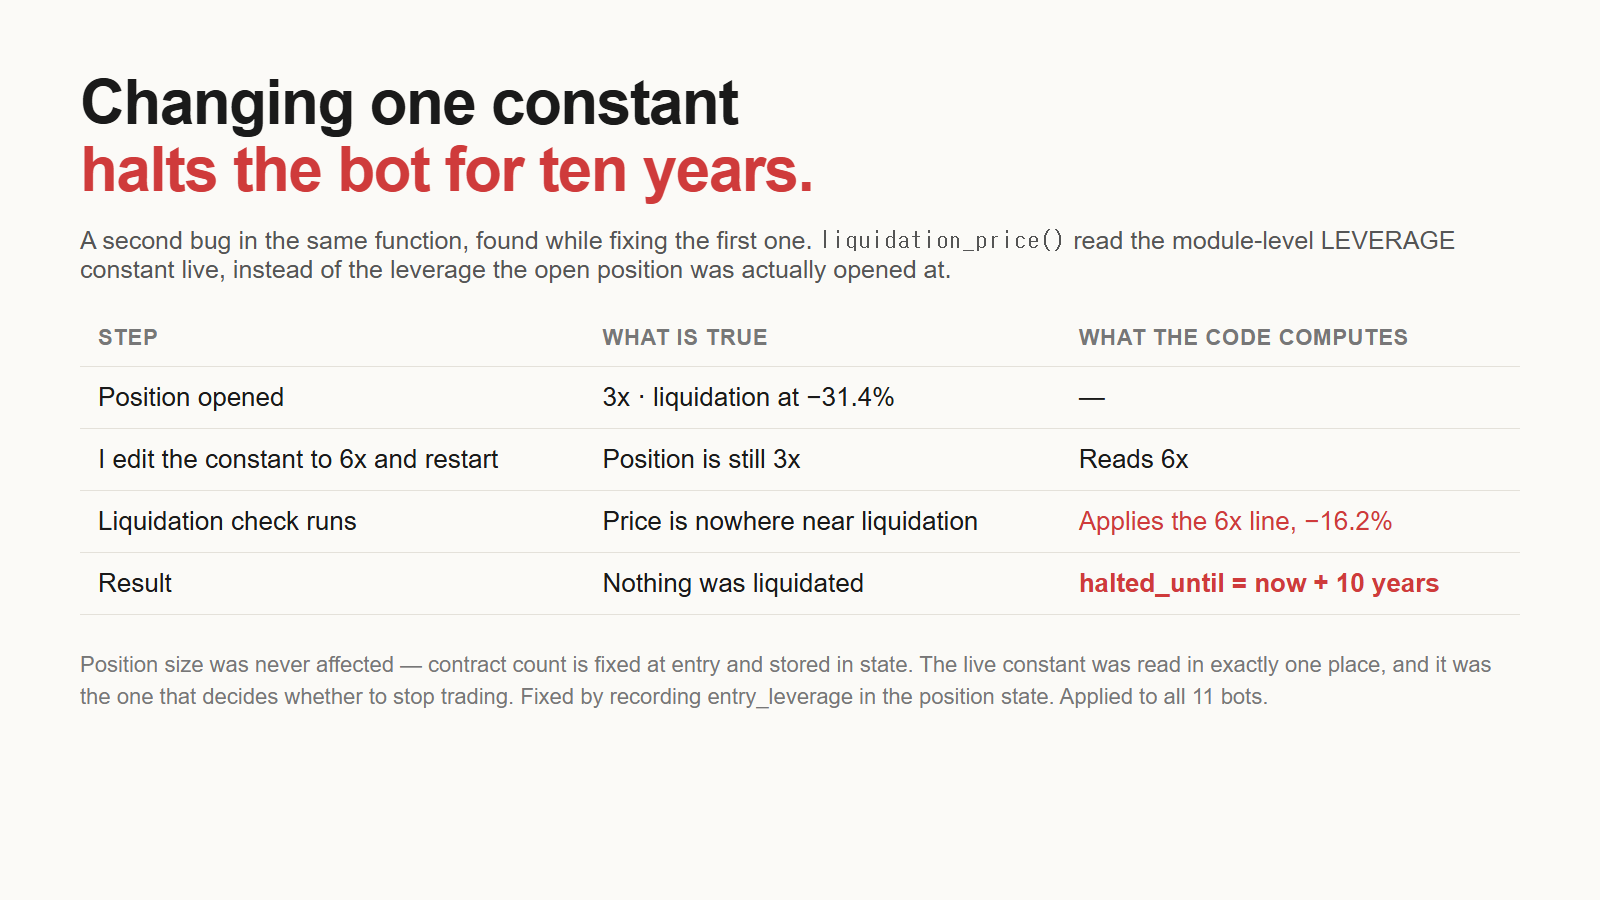
The function read the module-level leverage constant at call time, rather than the leverage the open position was actually opened at. So if I edited the constant from 3x to 6x and restarted while a position was open, the bot would apply a 6x liquidation line to a 3x position — roughly −16.2 percent instead of −31.4 percent.
The failure mode is not a bad trade. It is a liquidation that never happened, detected as if it had. And the handler for a detected liquidation pushes halted_until ten years into the future, on the reasonable theory that if you just got liquidated you should stop trading immediately.
So the bot would silently stop. No crash, no error, no alert, because from its own point of view it had done the correct and careful thing.
Position sizing was never exposed to this. Contract count is fixed at entry and stored in the position state. The live constant leaked into exactly one calculation, and it happened to be the one that decides whether to keep trading at all. It is now read from entry_leverage, recorded in the state at entry, across all eleven bots.
The three bots I was changing all happened to be flat at that moment. That is luck, not process.
The stop loss was on the wrong side of the liquidation line
The leverage change had a side effect I did not go looking for, and it is arguably the worst thing in this post.
The strategy's first stop sits four ATR away from entry. ATR is volatility, so in calm conditions that stop is close and in violent conditions it is far. The liquidation line, meanwhile, does not move with volatility at all — it is a fixed percentage set by leverage.
Which means there is a volatility level above which the stop loss is further away than the liquidation price. Past that point the stop is decorative. Price reaches liquidation first, every time, and the protection you designed never gets a chance to fire.
At 15x that crossover sat at 1.542 percent ATR, and 5.0 percent of historical entries were taken above it. One entry in twenty was opened into a state where no safety device in the system could act before the exchange did. At 10x the crossover moves to 2.375 percent and that share drops sharply.
I want to be clear that I did not find this by being careful. I found it because I was already editing the liquidation code for a different reason and the numbers happened to be in front of me. Nothing in my testing would have surfaced it, because every individual component was working exactly as specified. The stop fired when it was supposed to. The liquidation check computed the right line. The bug was in the relationship between two correct things, and no unit test has an opinion about that.
Adding this to your own engine
If your backtest tracks positions but not liquidation, the missing piece is smaller than it sounds. For isolated margin you need three things:
- The liquidation price, roughly average entry × (1 − 1/leverage + maintenance margin) for a long. Your exchange publishes the maintenance margin rate per instrument and per position tier.
- A check against the bar's extreme, not its close. Liquidation triggers intrabar. If you only compare against closing prices you will miss most of them, which is a quieter version of not modelling it at all.
- Recomputation on every size change. If the strategy scales in or out, average entry moves and so does the line. This is the part that bit me.
Then run your existing parameter sweep again and see which conclusions survive. The value is not in the new equity curve, it is in finding out which of your past decisions were made in a world without margin calls. For me it was the single most consequential setting in the bot.
One warning from doing it: expect the drawdown column to stop being a smooth function of leverage. Without liquidation, drawdown rises gradually as you add leverage and you can eyeball a tradeoff. With it, the column is flat and then it is ninety-something. There is a cliff, and the whole point of the exercise is finding which side of it you are standing on.
What I take from this
A backtest is a model of the parts you remembered to model. Mine was detailed about fees and fills, to four decimal places, and completely silent about the exchange closing my position. Precision in the parts you built is not evidence about the parts you did not.
Ask what the simulation cannot represent. Not "is this accurate", which invites you to admire the parts you can see, but "what event in the real world has no corresponding line of code here". Forced liquidation had no representation at all. It could not show up as a wrong number, only as an absent one. This is the same failure I hit trusting a single pass of Search Console data, wearing a different costume: the tool answers the question you asked, confidently, and says nothing at all about the question you did not.
Check the safety margin against the correct reference point. I did the right calculation on the wrong price for months. The strategy moves its own average entry every time it adds to a loser, which means the liquidation line moves too, and any check anchored to the first entry is measuring a position that no longer exists.
An alarm that fires on a false positive is a failure mode. The ten-year halt was deliberate and it was the correct response to a real liquidation. Fed a phantom one, the same code becomes an outage that reports nothing.
What I am not claiming
These figures come from 155 trades over four years and are dominated by a handful of outliers, so the confidence interval on any single number here is wide. I would not defend "+397,796 percent at 10x" as a forecast of anything, and the difference between 10x and 8x is well inside the noise.
Two things survive that caveat, and they are the only two I acted on: liquidation pushes drawdown into the nineties the first time it occurs, and at 10x it does not occur in this history. Those are directional and they do not depend on the exact returns being right.
All eleven bots are running on paper at the moment, for a separate reason worth its own post — measured fill quality made the expected value negative. So the practical cost of this particular mistake was zero. The next one will not be, which is why I would rather find them in the engine than in the account.


Comments
Post a Comment